Introduction
Jira dashboards are a central feature of Atlassian's project management tool, designed to provide users with real-time insights into their projects and workflows. They act as visual representations of key data, metrics, and progress, allowing teams to monitor their work, track issues, and make data-driven decisions effectively. This article will explore what Jira dashboards are, how they work, their components, and how to create and customize them.
What is a Jira Dashboard?
A Jira dashboard is a personalized workspace that consolidates information from different Jira projects, issues, workflows, and reports into a single view. It provides visibility into the status of tasks, team performance, project progress, and other key insights using visual widgets and data visualization tools. Dashboards can be tailored to meet the needs of various stakeholders, including project managers, team members, and business analysts. They can focus on team performance, sprint progress, backlogs, open issues, or any other metric important to achieving project goals.
Key Features of Jira Dashboards
Jira dashboards offer several core features that make them a vital part of project tracking and management:
1. Customization
- Dashboards can be customized with a variety of gadgets/widgets.
- Users can choose from predefined gadgets or create custom ones to monitor specific KPIs.
2. Widgets/Gadgets
- Widgets are modular elements on a dashboard that visualize data.
- Common gadgets include pie charts, issue statistics, sprint burndown charts, and filter results.
3. Real-Time Insights
- Dashboards update dynamically, providing real-time data as it changes in Jira.
4. Access Control
- Dashboards can be shared with specific team members or groups to ensure only the relevant users have access.
5. Multiple Dashboards
- Users can have multiple dashboards based on their role, project needs, or reporting focus.
What is a Jira Dashboard?
A Jira dashboard is a personalized workspace that consolidates information from different Jira projects, issues, workflows, and reports into a single view. It provides visibility into the status of tasks, team performance, project progress, and other key insights using visual widgets and data visualization tools. Dashboards can be tailored to meet the needs of various stakeholders, including project managers, team members, and business analysts. They can focus on team performance, sprint progress, backlogs, open issues, or any other metric important to achieving project goals.
Understanding Dashboard Gadgets
Gadgets are the building blocks of Jira dashboards. They pull in information from your Jira instance to provide insights into your project progress and metrics. Here are some of the most popular types of gadgets:
1. Filter Results
- Displays a list of issues based on a JQL (Jira Query Language) filter.
- Useful for monitoring specific sets of issues, such as "open bugs" or "tasks assigned to a team member."
2. Pie Chart
- Visualizes data distribution, such as issue priorities, assignees, or statuses.
3. Two Dimensional Filter Statistics
- Combines two sets of JQL data, allowing you to analyze data intersections like assignees and issue statuses.
4. Sprint Burndown Chart
- Tracks the progress of a sprint by comparing completed work against the planned scope over time.
5. Issue Statistics
- Displays key metrics like open vs. resolved issues across different categories.
6. Average Age Chart
- Tracks how long issues have been open, helping identify bottlenecks.
These gadgets can help project managers and team members quickly visualize key performance trends and assess progress.
How to Create a Jira Dashboard
Creating a Jira dashboard is straightforward. Follow these steps:
1. Navigate to Dashboards
- Go to the Dashboards menu in Jira.
- Select Create Dashboard.
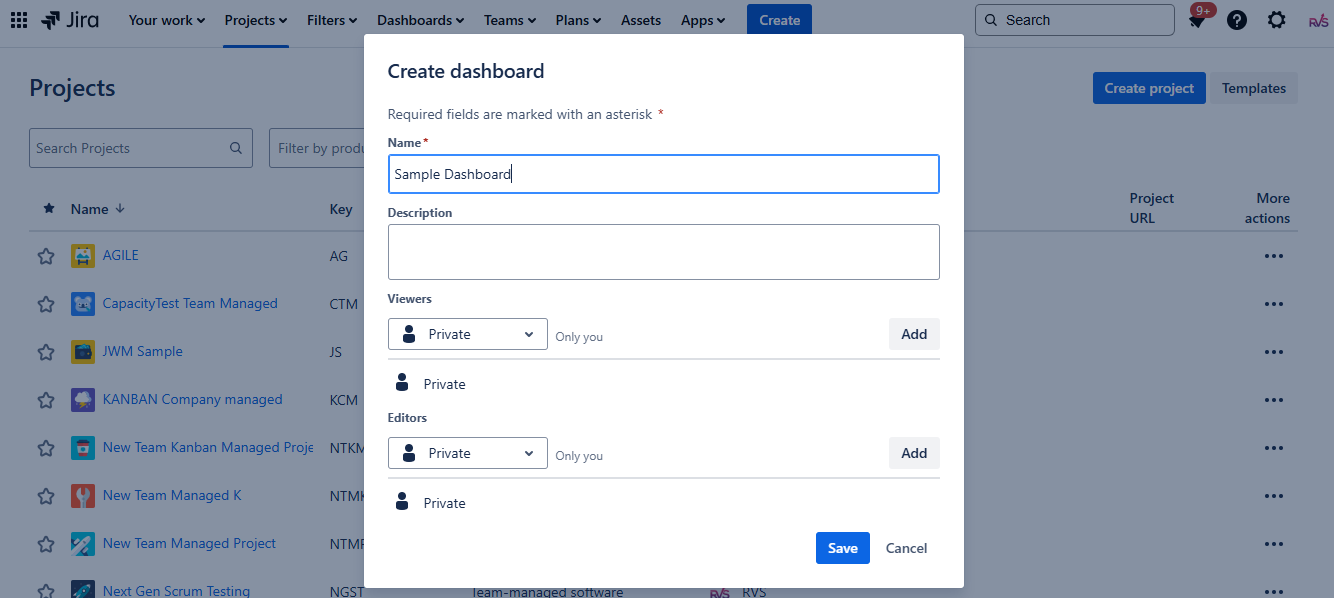
2. Provide Dashboard Details
- Name your dashboard.
- Optionally, provide a description.
- Select whether you want the dashboard to be private, shared, or available to a specific group.
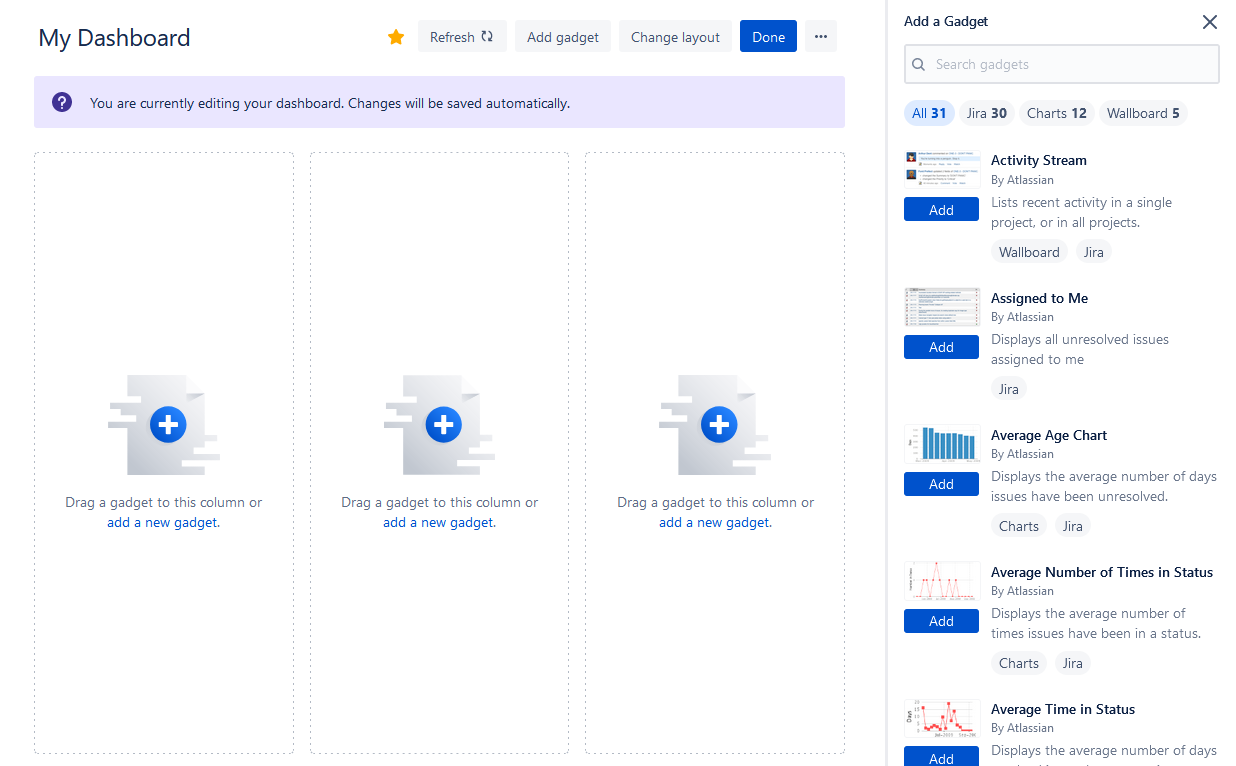
3. Add Gadgets
- Once the dashboard is created, click Add Gadget.
- Choose the gadgets that are relevant to the insights you want to monitor.
- Configure each gadget with the appropriate filters, projects, or JQL queries.
4. Arrange Your Dashboard Layout
- Drag and drop gadgets to rearrange them on your dashboard.
- Resize the gadgets to focus on the most critical data.
5. Save and Share
- Once the dashboard is set up, save the changes.
- Share it with team members, stakeholders, or groups as necessary.
Best Practices for Jira Dashboards
To get the most out of your Jira dashboards, consider these best practices:
1. Define Clear Goals
- Dashboards should align with specific team goals or reporting objectives. Ask: What questions am I trying to answer with this dashboard?
2. Prioritize Key Metrics
- Avoid clutter. Choose only the most relevant gadgets to ensure quick insights.
3. Regularly Review and Update
- As projects evolve, dashboards should change to reflect current needs and priorities.
4. Optimize for Your Audience
- Tailor dashboards for different users (team leads, stakeholders, developers, etc.) so they show the most meaningful insights.
5. Leverage JQL for Precision
- Use advanced JQL queries to ensure your gadgets pull the exact data you need.
6. Focus on Trends and Patterns
- Dashboards should help identify trends over time, not just static snapshots of data.
Common Use Cases for Jira Dashboards
Jira dashboards can be tailored to fit many purposes. Some common use cases include:
- Sprint Monitoring: Visualizing sprint progress, backlog health, and burn-down trends for agile teams.
- Team Performance: Assessing metrics like resolved issues, average time to resolution, or open vs. completed tasks.
- Bug Tracking: Monitoring high-priority or unresolved bugs using pie charts and filter results.
- Project Status Reporting: Creating dashboards for stakeholders to review project health and KPIs.
- Resource Management: Understanding team member workloads, task assignments, and capacity planning.
Improve Workflow Efficiency with Time in Status in Jira as a Dashboard Gadget
"Time in Status Reports" app by RVS can be easily added as dashboard gadget and can provide Jira Time in Status values on Jira dashboards. Some of the popular and much needed reports which the app provides are as below.
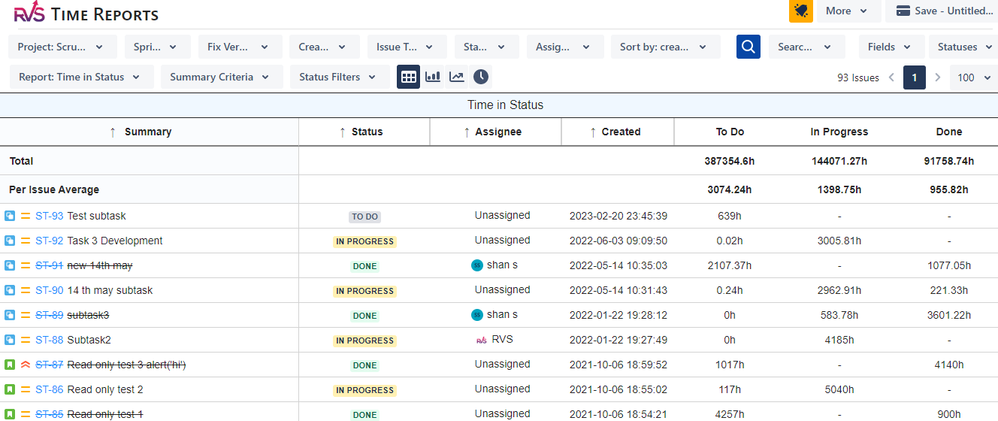
Time in Status report
This report shows how long each issue has spent in your workflow statuses. It helps to make urgent decisions regarding team workflow steps. You can filter data by Project, Fix Version, Sprint, Issue created date, Issue Types, Status, Assignee, Jira Filter, JQL. It will help to generate an accurate, detailed report based on the chosen criteria.
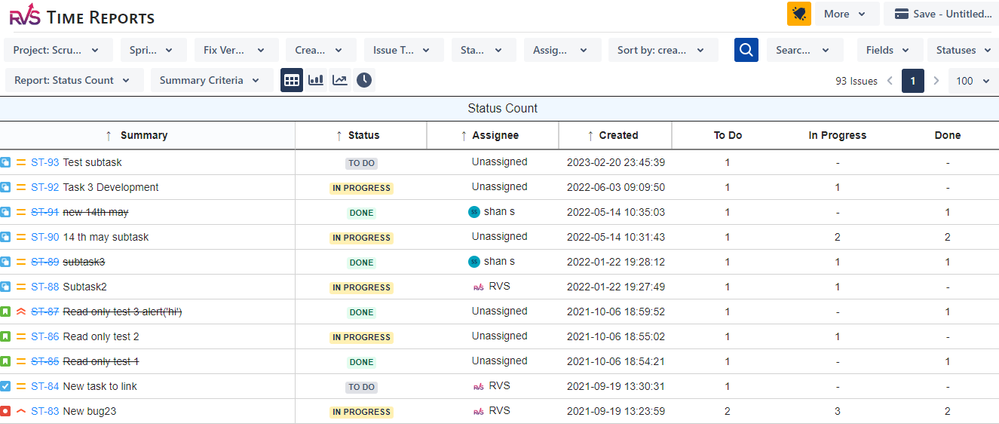
Status Count report
The Status Count report shows how often an issue has moved to each workflow status. So you can monitor how many times an issue moves to the "On Hold" or "Under Review" statuses and identify whether some delays occur.
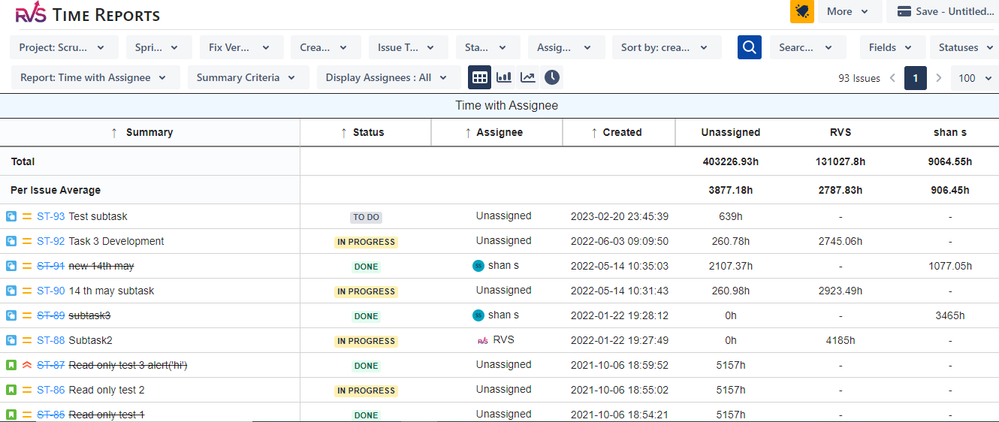
Time with Assignee report
The Assignee time report shows the total time a particular assignee has been working on the issue. That’s why it’s especially useful for identifying who is responsible for the workflow delays. It shows which assignee has been solving the task longer than it might be necessary.
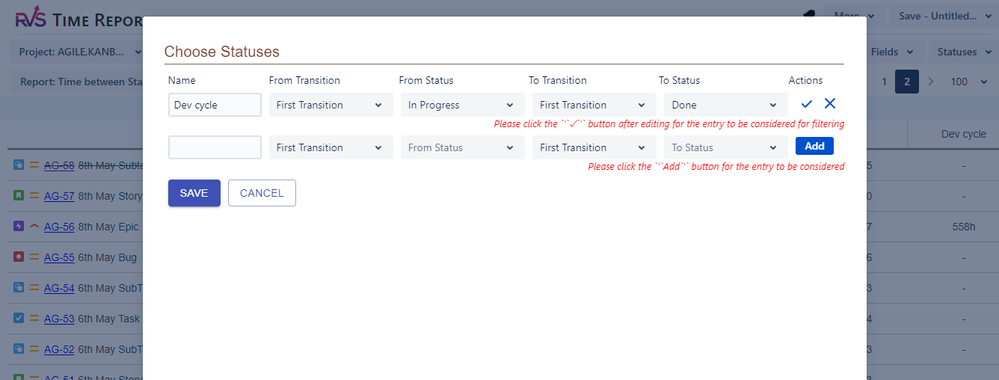
Time between Status Transitions
This report helps in calculating the time between 2 specific statuses in the issue workflow.
The above reports provided by App, Time in Status Reports by RVS, provides more details and can be more customized according to your needs. These reports generate a great amount of data and help teams deliver high-quality products quickly and efficiently, making them more competitive.
There are 20+ reports which the app provides.
For more information, visit here and get a 30-day free trial for Time in Status Reports by RVS now.
Conclusion
Jira dashboards are an essential tool for teams looking to streamline their project tracking, reporting, and decision-making processes. With customizable gadgets, real-time insights, and powerful visualizations, they allow users to monitor progress, detect bottlenecks, and make strategic decisions faster.
By focusing on customization, simplicity, and clarity, Jira dashboards can ensure that your team has the insights needed to succeed.
Whether you are new to Jira or an experienced user, investing time in designing and configuring the right dashboard will pay off by improving transparency, productivity, and collaboration across your team.
